A simple probability is calculated by dividing a specific outcome by all the possible outcomes.

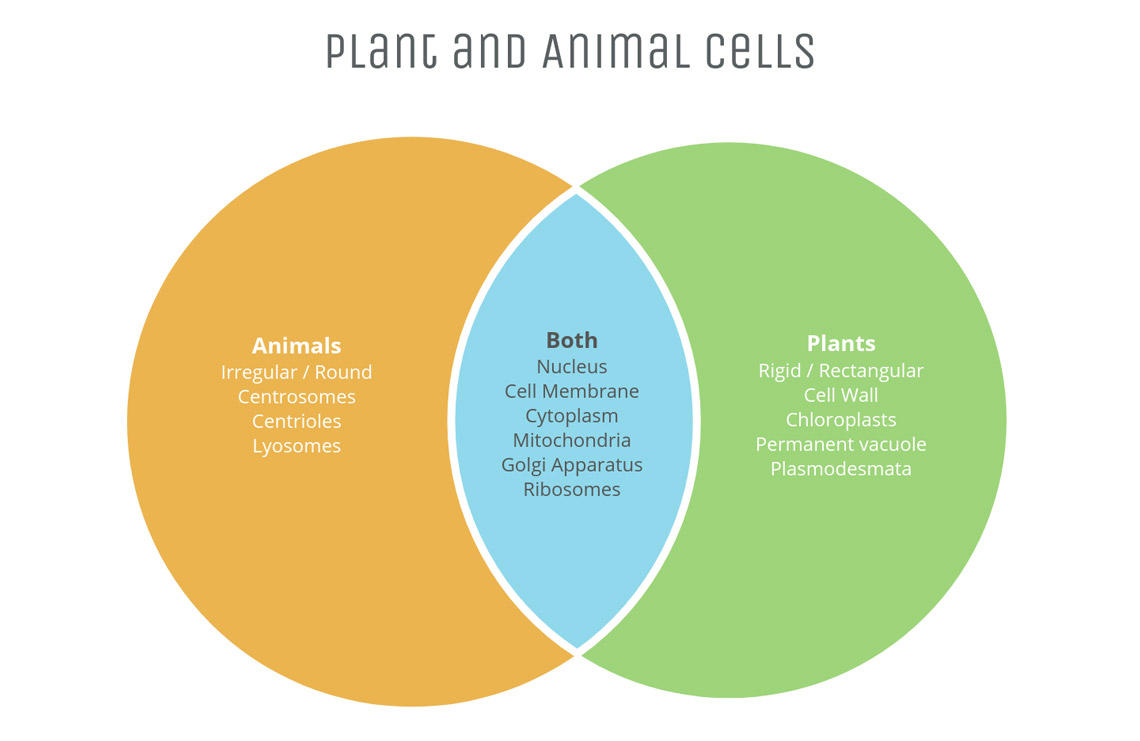
Venn diagram
A Venn diagram is a diagram that helps us visualize the logical relationship between sets and their elements and helps us solve examples based on these sets. A Venn diagram typically uses intersecting and non-intersecting circles to denote the relationship between sets.

Tree diagram
Tree diagrams are useful for calculating combined probabilities for sequences of events. It helps you to map out the probabilities of many possibilities graphically, without the use of complicated probability formulas. A probability tree has two main parts: the branches and the ends(sometimes called leaves). The probability of each branch is generally written on the branches, while the outcome is written on the ends of the branches.
Here is a tree diagram for two tosses of a coin:
Example: Soccer Game
You are off to soccer, and love being the Goalkeeper, but that depends who is the Coach today:
- with Coach Sam the probability of being Goalkeeper is 0.5
- with Coach Alex the probability of being Goalkeeper is 0.3
Sam is Coach more often ... about 6 out of every 10 games (a probability of 0.6).
So, what is the probability you will be a Goalkeeper today?
